




What we do · Dashboards and reporting
One set of numbers, without the Monday export
Every tool you run reports its own numbers. We bring them into one place, remove the duplicates, agree what each number means, and put it on a dashboard that is right on Monday morning.
- Price
- From $2,500 one-time; most builds $5,000 to $15,000
- Time
- 3 to 6 weeks
- For
- Teams that export, clean and paste reports every week, or argue about whose number is right.
- You own
- The data store, in your tenancy
In short
Dashboards and reporting bring the data from every tool you run into one place, remove duplicates and agree one definition for each number. On top of that we build live dashboards, a weekly summary written by AI from the figures, and alerts when a number moves past a threshold. Builds start at $2,500, one-time; most land between $5,000 and $15,000.
Is this you?
If three of these sound like your week, dashboards and reporting is the place to start.
- A weekly report takes someone a day to build
- Two people bring different numbers to the same meeting
- The same customer appears in three tools under three spellings
- You learn a number went wrong at month end, not the day it moved
- Leadership asks for a report and waits a week
What this is not
So the scope is clear before the call.
- A dashboard before anyone has agreed what the numbers mean. We settle definitions first.
- Forecasts written by AI with no figures behind them.
Most often for
What we have built
Dashboards and reporting in practice.
- Solution
Data consolidation
How we bring scattered tools into one set of numbers, step by step.
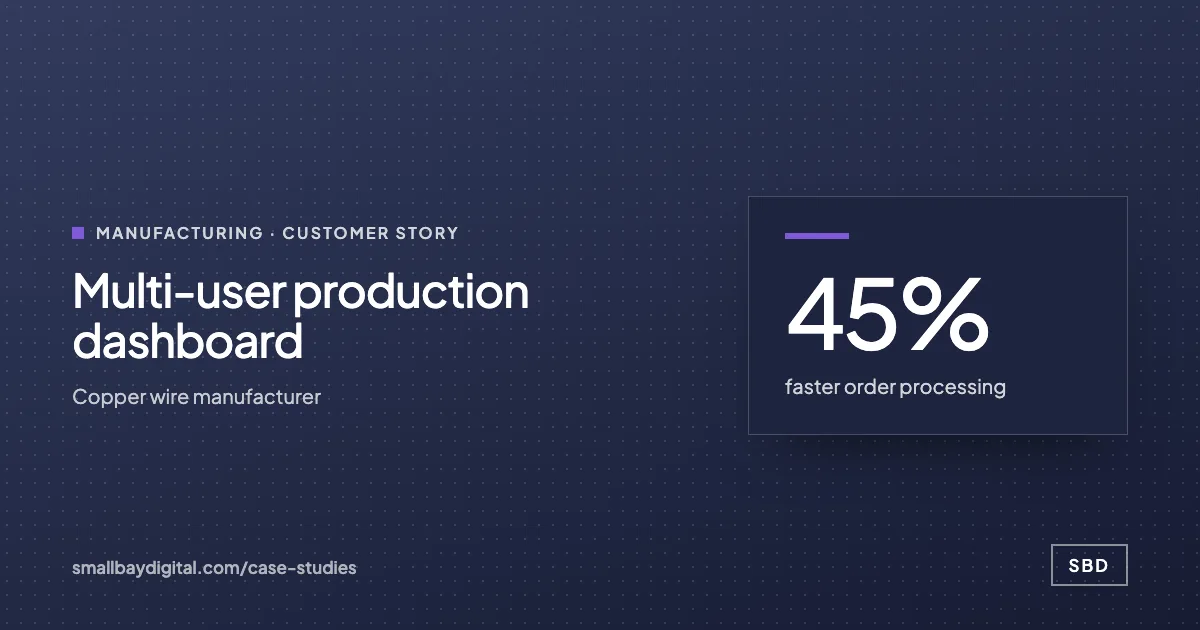
Read the story - Manufacturing
A live production dashboard
Paper and sheets replaced by ten modules and role-based access: 45% faster order processing.
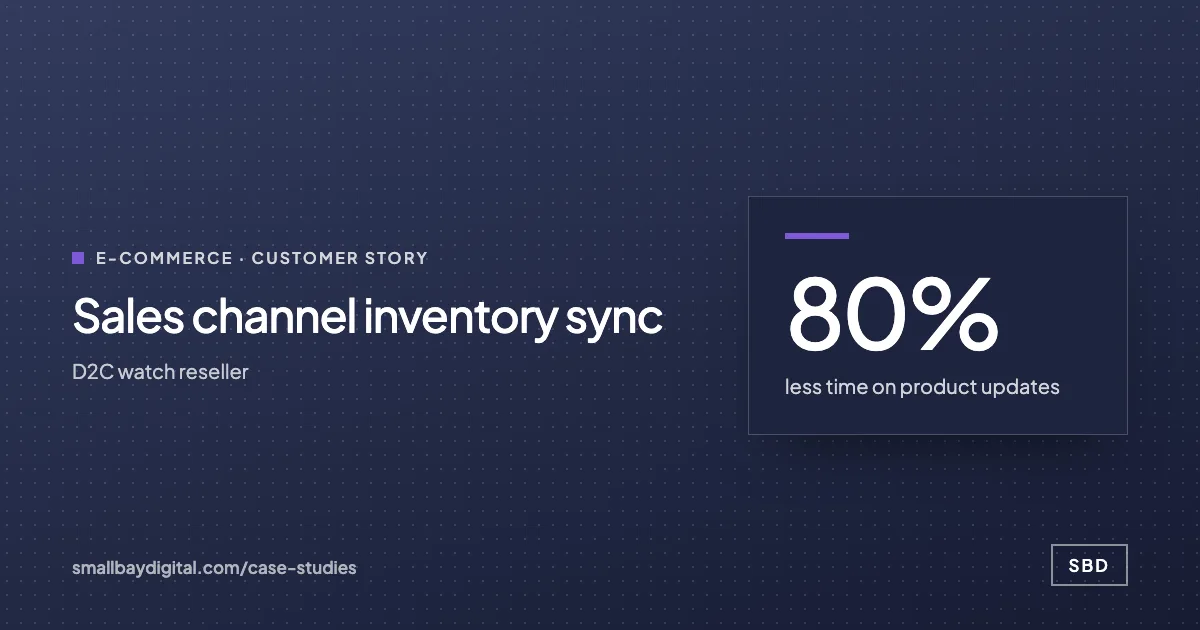
Read the story - E-commerce
Stock and prices from every channel
Three marketplaces reconciled to one product record with zero mismatches.
Read the story
Dashboards and reporting
One set of numbers.
Send us the report your team rebuilds every week. We will show you where each number would come from and how it would stay right.
See data consolidation
How it runs
Dashboards and reporting, step by step.
- 1Week 1
Every report and the decisions it feeds are listed. Each number gets one written definition and one source system.
- 2Weeks 2 to 3
Data is pulled from each tool into one store, duplicates are matched and removed, and the totals are checked against your current reports.
- 3Weeks 4 to 5
Live dashboards for each role, a weekly AI summary sent to the people who need it, and alerts on the thresholds you choose.
- 4Go-live
The manual report stops once the dashboard has matched it for an agreed period. Hypercare begins.
What you get
- One data store fed from every tool in scope, refreshed on a schedule
- Deduplication rules and a written definition for every metric
- Live dashboards by role
- A weekly AI summary built only from the figures on the dashboard
- Threshold alerts to a named person
How we know it is done
- Dashboard totals reconcile with the source systems for an agreed period
- Every metric has a written definition and an owner
- The weekly manual report is no longer produced
What you own
- The data store, in your tenancy
- The pipelines and dashboards, in your accounts
- The metric definitions
- The documentation
of small and mid-size business leaders say data is inconsistent across their business tools
Source: Salesforce SMB Trends, 6th editionBuilt on
The tools you already run, where we can.
-
 Supabase
-
 PostgreSQL
- Looker Studio
-
 Retool
-
 n8n
-
 Claude
Proof
Customer stories.
“Most reporting problems are definition problems. Agree what the number means first, and the dashboard is the easy part.”
How it starts
Every project starts with an audit.
One to two weeks with the people who do the work. A costed blueprint in order of payback. The $500 is credited in full to the build.
- Audit1 to 2 weeks. $500, credited to your build.
- BlueprintIncluded in the audit’s second week. Included with the Audit; quoted separately for multi-phase programmes.
- Build2 to 8 weeks. From $2,500 one-time; most builds $5,000 to $15,000.
- Run60 days of hypercare, then monthly. Hypercare included; care plans from $50/month.
Questions
What people ask about dashboards and reporting.
Do we need a data warehouse?
Not always. For most teams under a few hundred people, a Postgres database such as Supabase is enough and costs little. A warehouse is recommended only when volume or the number of sources calls for it.
Which dashboard tool do you use?
Whichever your team will open: Looker Studio, Retool or a custom page. If you already pay for one, we use it.
Can the AI summary get a number wrong?
It writes only from the figures on the dashboard, and each figure in the summary links back to its source. It describes and compares; it does not invent numbers or forecasts.
Who owns the code, the workflows and the accounts?
You do, from the first sprint. Every tool, automation and database lives in accounts in your name. Code sits in your repository. Documentation is part of the deliverable. If you stop working with us, everything keeps running.
How and when do we pay?
Fixed-price work is invoiced in milestones: a deposit at kick-off, then a payment at each sprint review. Care plans are monthly in advance and cancel with 30 days’ notice. Platform and model costs pass through at cost and are itemised.
Reading
- Strategy
The 95% figure, read properly
MIT says 95% of generative AI pilots show no profit impact. The study was 52 interviews, 153 survey responses and 300 public deployments. What it measured, what it did not, what the other 5% did, and why we quote it anyway.
- Strategy
Automation vs AI systems: what moves the number
Stacking task automations stalls at around twenty. The difference between a task and a system, the five layers that make a system hold, and which workflow to rebuild first.
Also what we do
- What we do
Automate
Teams re-typing data between tools, chasing status by hand, or waiting a day for a report.
- What we do
Modernise
Companies running a $5M to $100M operation on spreadsheets, a legacy ERP or a tool nobody dares change.
- What we do
Advise
Founders and COOs making technology decisions without anyone senior to check them.
- What we do
Extend
Teams that already run a platform but are out of capacity, or need a skill they do not have in-house.
- What we do
Harden
Founders who shipped something real with an AI builder and need it to survive real customers, investors or an audit.
- What we do
AI agents
Teams with a multi-step task that needs reading or judgement, a clear goal and a person willing to approve the outcome.
- What we do
Integrations
Teams whose tools each hold part of the truth and who re-key data between them every day.
- What we do
Internal tools and portals
Teams running the business from spreadsheets and inboxes, or sending customers and suppliers status by email.
Related: Integrations, Internal tools and portals, Audit
Dashboards and reporting
Talk to the people who would build it.
A discovery call. Bring the work your team still does by hand. You leave with a yes or no on fit and the first thing we would build.
Book a discovery call